The social media landscape changes almost as quickly as you hit “retweet.” New trends pop up as platform developers design new features and algorithms that influence user behavior. Similarly, some topics, trends and features quickly become outdated and, eventually, obsolete.
For instance, think of how it was once the norm to post on someone’s Facebook Wall. Now you hardly see that anymore, and you’ll probably find it weird or intrusive if someone posts a message on your Timeline. And think of how Instagram came up with Stories in 2016 and in just three years managed to attract over 500 million daily users of the feature.
That’s enough proof of how fast the social media landscape evolves.
This makes it crucial for marketers to always stay updated with fresh trends and social media statistics that could have an impact on their existing strategies.
Here are 55 social media stats you should make a note of in 2020.
When it comes to social media platforms, Facebook continues to dominate. It remains the most used platform among both marketers and consumers, Here are some noteworthy social media statistics related to Facebook:
- 89% of marketers use Facebook in their brand marketing efforts.
- 83% of surveyed consumers use the platform.
- 66% say they Like or Follow a brand on the platform.
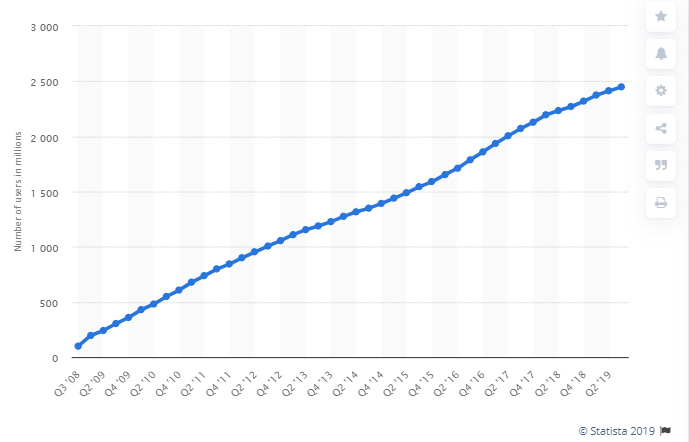
- By the third quarter of 2019, the platform had attracted 2.5 million monthly active users
- Live video is becoming a vital tool for social marketers, and 42% of them have already developed a strategy for Facebook Live.
- From posting a median of 0.97 posts per day, brands are seeing a median engagement rate of 0.09% on the platform across all industries.
- Along with its growing user base, the platform also sees an increase in revenue. It generated $17.65 billion in total revenue in the third quarter of 2019.
- Out of this, a majority came from advertising. This isn’t too surprising considering how Facebook had over 7 million advertisers during Q3 of 2019.
- Facebook use among U.S. marketers is on a slight increase from 86.3% in 2018 to 86.8% in 2019. This number will likely reach 87.1% in 2020.
Among all social media platforms, Instagram likely sees the most evolution with new features every few months. In 2019 alone, the platform was testing a new display layout for IGTV, hiding likes in the U.S and introducing “Reels” mode akin to TikTok. And in late 2019, Instagram introduced a layout feature for Instagram Stories, allowing users to post multiple pictures on one screen. This goes to show how Instagram constantly strives to stay relevant and update its features with the changing times.
So it’s only natural that the platform will continue to see an increase in user count and engagement. These Instagram-specific social media statistics paint a clearer picture:
- Instagram now has over 1 billion monthly active users–a 42.86% increase from 2017 when it had 700 million. That’s a lot of growth in just two years’ time.
- Among these users, 90% follow a business on the platform, suggesting that Instagram users are keen on hearing from and about brands.
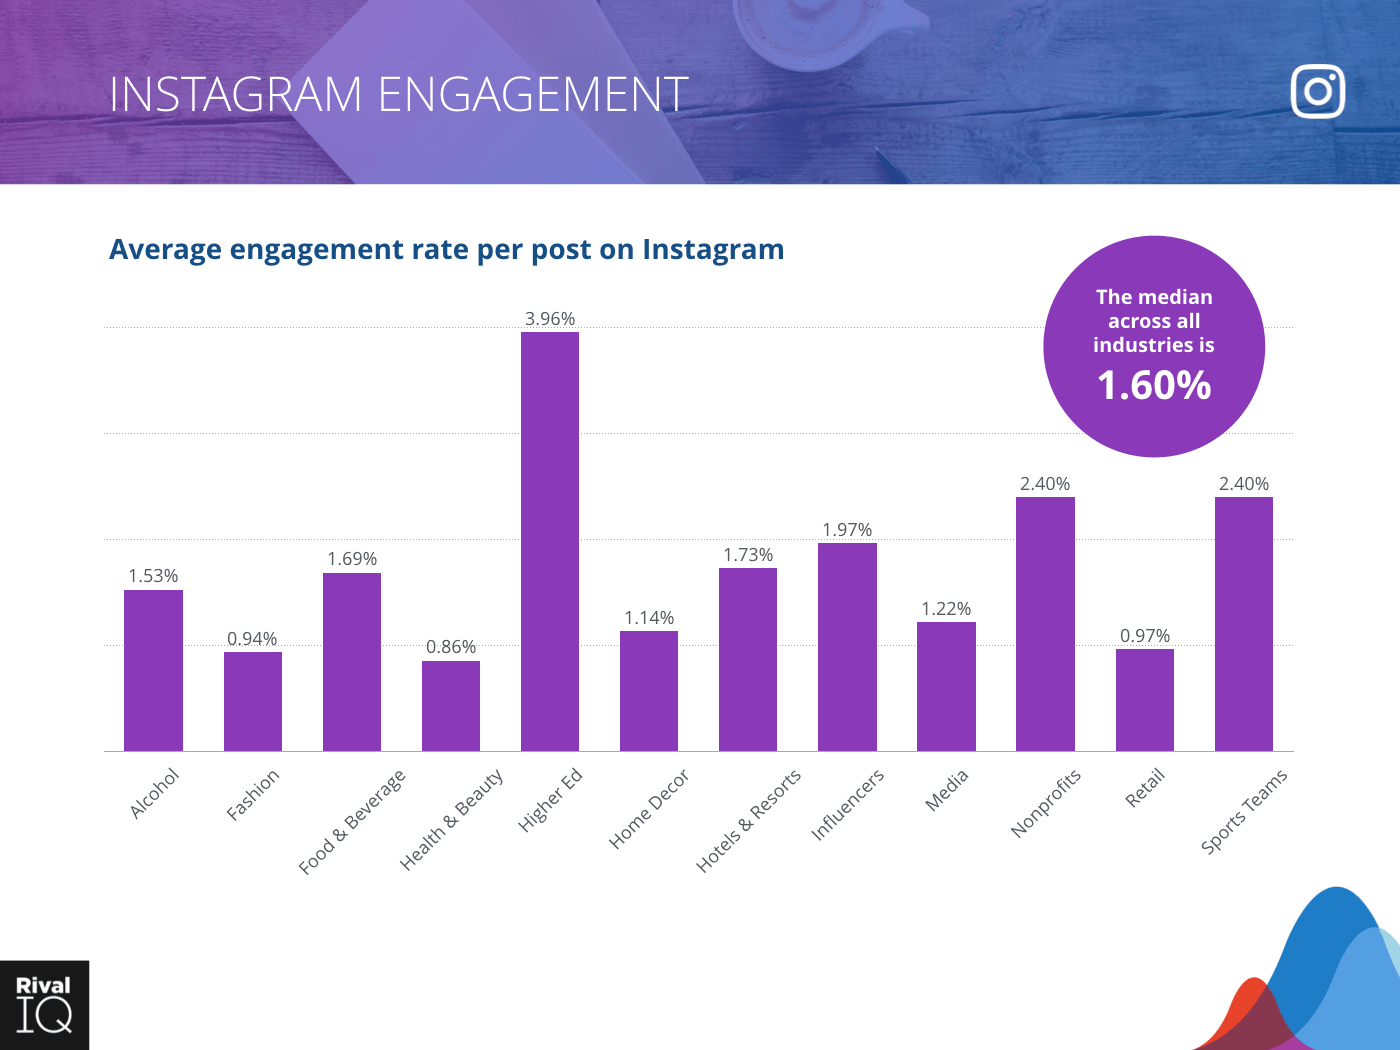
- The platform also takes the cake when it comes to engagement. Brands are driving a median engagement of 1.60% across all industries on Instagram.
- Instagram continues to be the most popular influencer marketing 89% of marketers in a Mediakix survey say that it’s the most important social media platform for influencer marketing.
- 78% say that Instagram posts are the most effective content format for influencer marketing, while 73% say the same about Instagram Stories.
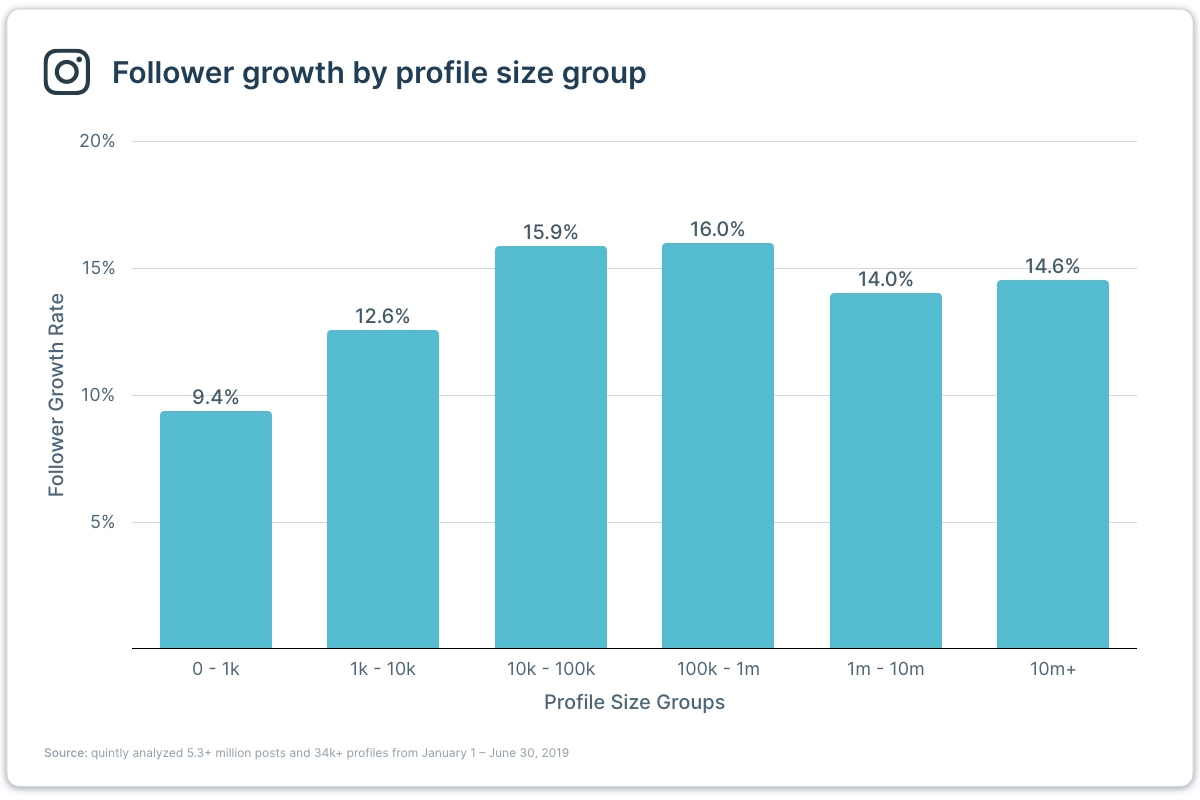
- Instagram profiles saw a follower growth rate of 9.4%–16% during the first half of 2019.
- Considering these factors, it’s not too much of a surprise that the platform is seeing an upward trend in ad revenue–jumping from $23.66 billion in 2018 to $28.52 billion in 2019. According to projections, Instagram will likely net $33.71 billion in ad revenue during 2020.
- Instagram is also the only platform where there’s a significant increase in usage by U.S marketers. The number jumped from 69.2% in 2018 to 73.2% in 2019, with the possibility of reaching 75.3% in 2020.
- The video seems to perform much better on the platform, seeing 49% higher interactions than image posts.
Twitter still stands strong as one of the top social media platforms in spite of a slight drop in user count during the last two quarters of 2018. Marketers should continue to keep an eye on the latest social media stats specific to the platform if they want to include it in their marketing mix.
- As of Q1 2019, Twitter has about 330 million active users worldwide.
- 79% of Twitter users like to discover what’s new, making it the top platform for discovery.
- People are also 26% more likely to view ads on the platform than on any other leading platform.
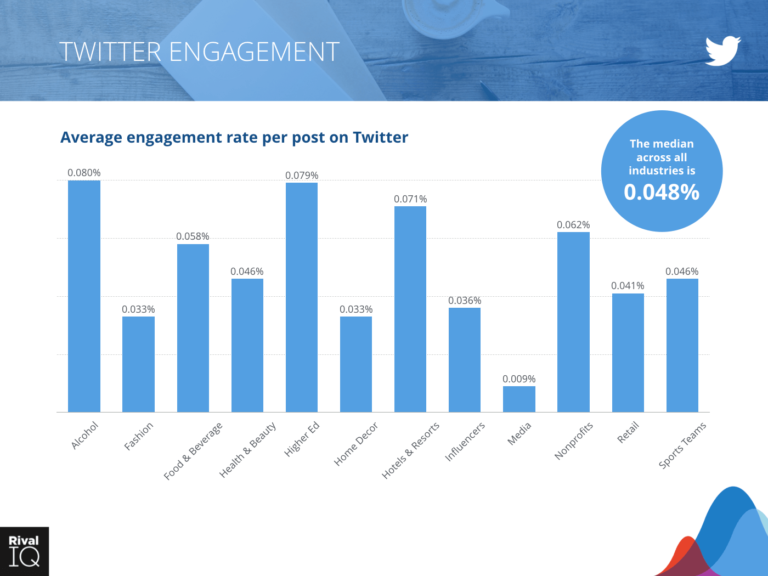
- Brands send out a median of 0.86 tweets per day, for which they see a median engagement of 0.048%.
- Twitter saw a 9% year-on-year increase in revenue for Q3 of 2019 with $824 million.
- Its domestic (U.S) revenue experienced a higher-than-usual growth of 24%, while its international income grew by 12%.
Pinterest is a platform for inspiration–whether it’s for home and seasonal décor, unique recipes, gifts, or DIY crafts. People use the platform to discover new brands and products, find new things to try, and get purchase inspiration.
Here are a few relevant social media statistics if you’re using Pinterest to market your brand:
- Pinterest has 300 million Global Monthly Active Users (MAUs).
- These users are highly active on the platform and have saved more than 200 billion Pins in total.
- 77% of weekly Pinners have discovered a new brand or product on the platform.
- 98% report trying new things they find on Pinterest.
- 83% of weekly Pinners have made a purchase based on the content they saw from brands on Pinterest.
- The platform sees a 30% year-over-year increase in monthly active users.
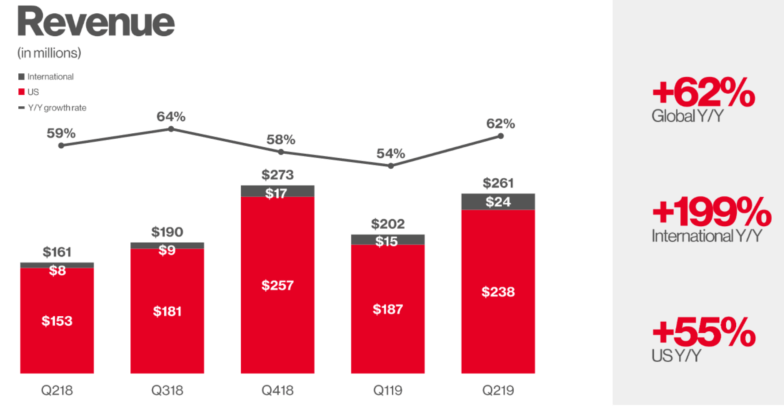
- During Q2 of 2019, Pinterest saw a 62% year-over-year increase in revenue, earning $261 million.
LinkedIn has a completely different audience type compared to other social media platforms and is the largest professional network. This makes it the ideal platform for B2B marketers as well as employers and job searchers alike.
Check out these fresh social media stats if you’re going to include LinkedIn in your marketing mix:
- The platform currently has over 660 million registered users, with 303 million of them being active on a monthly basis.
- 90 million of these users are senior-level influencers, and 63 million are in decision-making positions.
- LinkedIn has proven to be an effective platform for lead generation and customer acquisition. In fact, it’s 277% more effective than Facebook in generating leads.
- 45% of marketers have also gained customers through the platform.
- 65% of B2B companies have used LinkedIn paid ads to acquire customers.
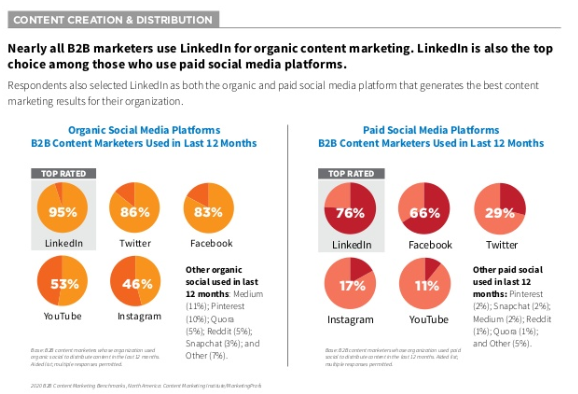
- 95% of B2B content marketers use LinkedIn for organic content marketing, making it the top-rated social media platform.
- It’s also the top-rated paid social media platform, with 76% of B2B content marketers using it.
- Naturally, the platform is seeing an upward trend in its revenue. While it generated $5.2 billion in revenue in 2018, the number went up to $6.7 billion in 2019.
Although organic growth is what we all strive for, changes in social media algorithms have made it much more challenging to achieve. Paid advertising has become somewhat of a necessity, rather than an option, for businesses that want to gain more visibility and strengthen the impact of their social marketing efforts.
Make the most of these social media advertising statistics to fuel your paid social efforts for 2020:
- Marketers are spending more on social media advertising; with social media, ad spends amounting to more than $89 billion in 2019.
- According to projections, this ad spend will see an annual growth rate of 8.7% and likely reach $102 billion by 2020.
- Mobile users contribute to a majority of social advertising revenue. In fact, 94% of the Facebook advertising revenue for Q3 of 2019 came from mobile.
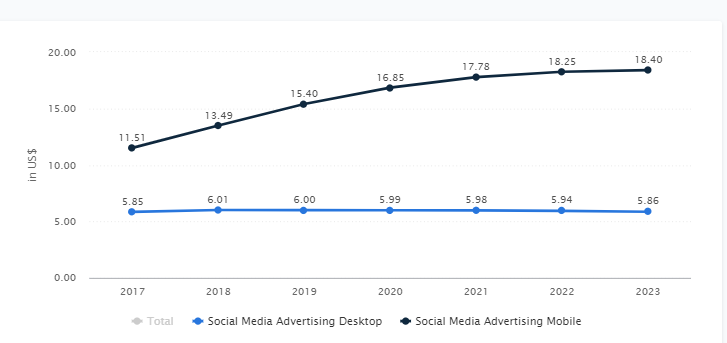
- The average ad spends per internet user also sees a gradual increase in mobile, jumping from $13.49 in 2018 to $15.40 in 2019. In 2020, advertisers will likely spend $16.85 per mobile internet user.
- There’s a significant increase in the adoption of new digital video ad formats like shoppable ads and Stories ads. And marketers are increasing their digital video budgets by 25% year-over-year.
- In fact, social network video ad spending accounted for 28.7% of total video ad spending, at $10.35 billion. We should expect to see a further increase in this number in 2020, as marketers invest around $12.48 on social media video ads.
- Pinterest experiences the highest increase in advertising reach with a 4.1% quarter-on-quarter increase. Instagram comes second with a 2.9% increase, and Twitter comes close with a 2.5% increase. LinkedIn sees a 2.2% increase in advertising reach quarter-on-quarter, while Facebook sees a 0.4% increase.
Learning about the latest social media advertising statistics and platform-specific performances gives you some insight into the current social marketing landscape. Some social media stats even give you insight as to what other marketers are doing on different platforms.
But most importantly, you’ll begin to understand consumer behavior and preferences on social media. For instance, there’s a growing appreciation for transparency and social consciousness among consumers, with social media playing a pivotal role in showcasing these brand values.
Check out the following consumer-related social media statistics that will help you take a consumer-first approach with your social media marketing:
- Social media helps amplify transparency, which can prove to be rewarding for brands in spite of the challenges it brings. In fact, 53% of consumers say they’re likely to buy from brands that are transparent on social. And 86% of Americans say transparency on social media is more important than ever before, which means they’re willing to take their business to a competitor if they see a lack of transparency.
- Admitting mistakes, giving an honest response to customer queries, providing product/service pricing, and showcasing manufacturing practices are some of the top ways for brands to demonstrate transparency via social.
- 53% of consumers expect brands to be transparent about product/service changes and company values on social media.
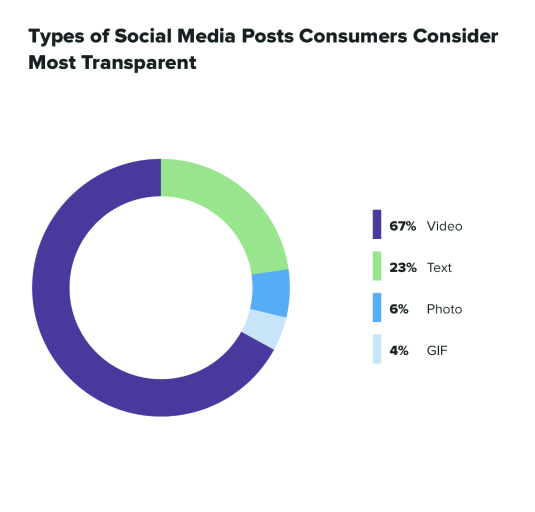
- 67% of consumers consider video to be the most transparent type of social media posts.
- Social consumers expect brands to be more socially conscious, with 70% saying that it’s important for brands to take a public stand on social and political issues.
- Taking a public stance can also have its own negative implications, because 55% of consumers say that they would boycott brands whose views don’t align with theirs.
- 47% of consumers expect brands to speak up about these issues over social media.
- According to 40% of consumers, collaborating with a relevant non-profit is the best way for brands to take a public stand on social media.
- With that said, 53% of consumers also believe that brands are only taking a stand for marketing and publicity. This makes it crucial for you to support causes that you genuinely believe in and make your support clear from the very start.
From these social media statistics, there are a few key takeaways that will help you adapt your strategy for 2020. First, the increasing adoption of video and live video makes it vital for you to include them in your marketing mix. Consider running video ads or streaming live broadcasts of company events, for example.
Second, prioritize mobile users when advertising on social media as they contribute the most to social advertising revenue. Expand your focus on platforms like Pinterest and Instagram (if you aren’t already) as they offer higher engagement and ad reach.
Most importantly, brands need to align their strategy to appeal to the conscious consumer as social and political responsibility seems to be a huge influencing factor in purchase decisions and brand loyalty.
What did you think of these social media stats? Which ones stand out the most to you and how will you use them? Let us know in the comments below.


